Category: Case Study

  • DataTruck Raises $12M Series A to Scale Its TMS Platform for SMB Carriers

    DataTruck Raises $12M Series A to Scale Its TMS Platform for SMB Carriers

    DataTruck just closed a $12M Series A.

    For anyone who's been watching the freight tech space, this isn't a surprise. It's a confirmation. DataTruck has been quietly building one of the sharpest TMS platforms on the market for SMB carriers, and this raise puts them in position to do what they've been doing — just faster.

    We've had a front-row seat to this story. DataTruck is a Phi client, and we've been part of their GTM journey since the early days. So this one feels personal.

    Here's what makes this raise worth paying attention to.

    From Founder-Led Sales to $2.5M ARR

    When DataTruck first came to us, the product was solid. Carriers liked it. Retention was strong. But growth was stuck in founder-led sales mode — deals closed through personal networks, warm intros, and the founders grinding through every conversation themselves.

    There was no dedicated sales team. No outbound infrastructure. No repeatable system for acquiring customers. CAC was sitting at $1,103.

    We started with one founding AE. One person, embedded inside DataTruck, building and running the entire outbound motion from scratch. ICP segmentation, pain-driven messaging for SMB carriers, cold outreach infrastructure across calls and email, and a full CRM build in HubSpot.

    Nine months later, DataTruck crossed $1M ARR.

    From there, the team scaled to five. We helped build out CRM architecture for higher volume, launched a product-led growth motion alongside outbound, and kept compounding.

    Twelve months after hitting $1M, DataTruck reached $2.5M ARR. CAC dropped from $1,103 to $530. For every dollar spent with Phi, DataTruck made $9 back. That ratio held the entire time.

    Read the full DataTruck case study →

    Why This Series A Matters for Freight Tech

    The freight tech space has seen a lot of funding over the past few years. A lot of it went to companies selling to enterprise shippers and mega-fleets. The SMB carrier segment — the 90%+ of carriers running 1 to 20 trucks — has been historically underserved.

    DataTruck built specifically for that segment. Their TMS is designed around the problems small carriers actually face: manual dispatch, messy billing, zero visibility into operations. Not a stripped-down version of an enterprise tool. A product built from the ground up for how small fleets actually work.

    That focus is what made the outbound motion work. When your messaging is built around real operational problems that your ICP deals with daily, conversion follows. DataTruck wasn't selling software. They were selling time back to owner-operators who were drowning in spreadsheets and phone calls.

    The $12M Series A, following a $700K pre-Series A round, gives DataTruck the capital to go deeper on product and wider on distribution. More carriers. More features. More coverage across the freight lifecycle.

    What Investors Are Betting On

    When DataTruck walked into their Series A conversations, they didn't lead with projections. They led with a working revenue engine.

    $2.5M in ARR. A 97% reduction in CAC. A sales team of five operating on proven playbooks and infrastructure. Month-over-month revenue additions that had more than doubled. A product-led growth channel running alongside outbound.

    This wasn't a bet on potential. It was a bet on a system that was already compounding.

    That's the difference between companies that raise on a story and companies that raise on a machine. DataTruck had both.

    Congratulations to the DataTruck Team

    We've watched this team go from founder-led hustle to a structured, scalable revenue operation. The product was always good. What changed was the engine around it.

    Building alongside DataTruck has been one of the more rewarding partnerships we've had at Phi. The team moves fast, listens to data, and isn't afraid to rebuild what isn't working. That mindset is rare, and it's a big part of why they're here.

    $12M is fuel. What DataTruck does with it is going to be worth watching.

    Congrats to the entire DataTruck team on the Series A. The best part of this story is that it's still early.

    Read Full case study here:


    Phi is a GTM execution partner for B2B startups. We helped DataTruck go from founder-led sales to $2.5M ARR through embedded sales teams, outbound infrastructure, and revenue systems. If you're building something similar, let's talk.

  • 7 GTM Truths AI Won’t Change (And What to Fix Before You Scale Into Chaos)

    7 GTM Truths AI Won’t Change (And What to Fix Before You Scale Into Chaos)

    The $2.3M Lesson:

    Last quarter, a Series B fintech founder called us in a panic.

    "We 10x'd our outbound volume with AI tools. Emails are flying. Content is everywhere. SDRs are busier than ever."

    Then the punchline: "Pipeline is down 23%."

    He'd made the same mistake we see at dozens of startups every year: he treated AI as a strategy when it's actually an accelerant.

    AI doesn't fix go-to-market. It scales go-to-market.

    If your GTM system is clear, AI becomes your execution engine – compounding your wins. If your GTM system is unclear, AI compounds the chaos: more outbound to wrong-fit accounts, more content that says nothing, more pipeline noise, more churn you "didn't see coming."

    That fintech founder? His ICP was "any company that handles payments." His sales team couldn't articulate why they won deals. His marketing and sales teams used different definitions of "qualified."

    AI just helped him do all of that faster.

    From an investor's perspective: VCs increasingly evaluate not just what you're building, but how efficiently you're acquiring customers. A founder who can demonstrate GTM clarity signals operational maturity and lower risk. The AI tools in your stack matter far less than the system underneath them.

    This guide is built for CEOs, founders, CROs, and GTM leaders at startups and scaleups who want to build a revenue engine that actually scales – before they pour AI fuel on the fire.

    You'll walk away with:

    • A 10-minute GTM Clarity Scorecard to diagnose your system

    • 7 fundamentals that don't change, even in an AI-first world

    • A 90-day GTM implementation roadmap

    • A practical path to execution if you want a team to run it with you

    The GTM Clarity Scorecard: Where Are You Leaking Revenue?

    Before we dive into the 7 truths, let's get a baseline. This diagnostic mirrors the frameworks we use in our comprehensive GTM audits.

    Score each statement 0–2:

    • 0 = not true

    • 1 = somewhat true

    • 2 = consistently true

    #

    Statement

    Score

    1

    We can describe our best-fit ICP in one sentence.

    2

    We know the top 3 triggers that create urgency to buy now.

    3

    We can name the main alternative we replace (status quo or competitor).

    4

    Our messaging clearly states why us, not just what we do.

    5

    Marketing, sales, and CS use one set of lifecycle stages.

    6

    Every pipeline stage has exit criteria and is measured consistently.

    7

    We know exactly where deals stall and why (top 3 reasons).

    8

    Champions have a consensus kit to align stakeholders internally.

    9

    Our onboarding and implementation plan is documented and repeatable.

    10

    We run a weekly GTM operating cadence with decisions, not status updates.

    What your score means:

    • 0–8: AI will amplify leakage. Fix fundamentals before scaling.

    • 9–14: You have a base, but your motion will drift without an operating system.

    • 15–20: You're ready to accelerate with AI across the lifecycle.

    Most Series A-C companies we work with score between 6 and 11. That's not a failure – it's a diagnostic. The question isn't "are we broken?" It's "where do we tighten first?"

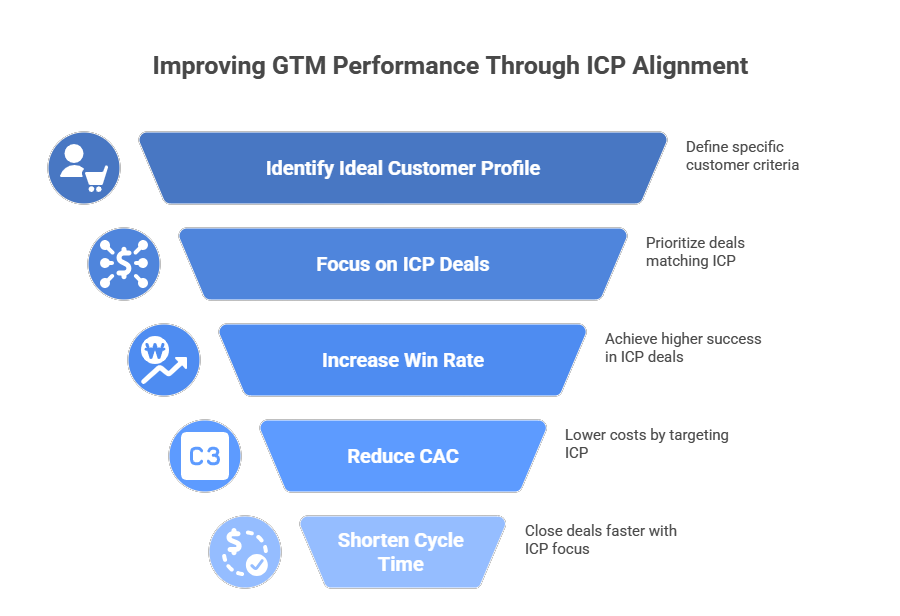
    Truth #1: Positioning Still Beats Productivity

    Clear positioning drives higher win rates. AI makes content and outreach cheaper, but it doesn't make your value proposition clearer. Startups that can't articulate who they win and why will scale confusion, not revenue.

    The Story

    A logistics SaaS company came to us after burning $400K on an AI-powered outbound motion. They'd sent 50,000 emails in 90 days. Response rate: 0.3%.

    The problem wasn't the tool. The problem was the message.

    When we asked three different sales reps to describe what they sold, we got three different answers. When we asked the founder who their best customer was, he said, "Honestly? Anyone moving freight."

    That's not an ICP. That's a prayer.

    What Weak Positioning Looks Like in Practice

    • You win deals but can't explain why you won them

    • Different reps describe the product differently on calls

    • "We're for everyone" shows up in your ICP definition, pricing, or product roadmap

    • You need heavy discounting or hero reps to close

    The Fix: The "We Win When" Framework

    Strong positioning answers three questions:

    "We win when…" (tight ICP + context)

    Example: "We win when mid-market logistics companies are switching from spreadsheets to their first TMS and need implementation support."

    "They buy because…" (value + outcomes)

    Example: "They buy because we reduce their time-to-value from 90 days to 21 days with white-glove onboarding."

    "They choose us over…" (alternative + differentiation)

    Example: "They choose us over McLeod because we're 60% cheaper and don't require dedicated IT resources."

    With a freight tech startup we advised, implementing this framework improved their win rates by approximately 35-45% within two quarters. The customer segmentation work we did upstream made every downstream activity more efficient.

    Key metric to track: Win rate by segment (ICP-fit accounts vs. everyone else)

    The takeaway: If you can't explain who you win and why, AI will scale confusion – not pipeline.

    Truth #2: Buying Committees Still Require Consensus, Not Persuasion

    B2B deals don't close because one champion is convinced. They close when the entire buying committee agrees. Most late-stage deal losses come from "no decision," not competitive loss. Your sales enablement strategy must include tools that help champions build internal consensus.

    The Story

    A proptech startup had a 67% win rate through Stage 3. Then deals started dying.

    Not to competitors. To "no decision."

    We shadowed five late-stage deals and found the same pattern: the champion loved the product, but couldn't get sign-off from security, finance, or the VP who'd ultimately own the implementation.

    The champion was sold. The committee wasn't.

    Why Consensus Complexity Is Increasing

    In real B2B—especially at scaleups – deals stall because someone in the committee doesn't agree:

    • Risk owner says "not safe"

    • Finance says "not provable"

    • Technical says "not implementable"

    • User says "not usable"

    • Exec sponsor says "not strategic"

    AI will increase self-education- which means more stakeholders form opinions earlier, often before your rep gets involved.

    The Fix: Build a Consensus Kit

    Give your champions the ammunition they need to sell internally. One link or one doc that contains:

    1. One-page problem/outcome summary – what you solve, what changes

    2. Implementation plan – timeline, roles, milestones, resources required

    3. Security and risk FAQ – pre-answer the blockers

    4. ROI model with editable assumptions – let finance validate

    5. One relevant case study – proof from a similar company

    From the customer's perspective: Your champion is taking career risk by advocating for your solution. If the implementation fails, they look bad. A consensus kit isn't just a sales tool – it's risk reduction for your buyer.

    Key metric to track: Stage-to-stage conversion rate (especially Stages 3→4 and 4→Closed)

    The takeaway: You're not selling a product. You're selling agreement.

    Truth #3: Trust Is Still the Real Speed Lever

    Sales velocity isn't about more touchpoints – it's about building buyer confidence faster. Trust in the vendor, trust in the implementation, and trust in the outcome are what compress sales cycles. AI can increase outreach volume but cannot manufacture credibility.

    The Story

    Two competitors. Same market. Same ACV.

    Company A had a 47-day average sales cycle. Company B had a 112-day average.

    The difference wasn't the product. It was proof.

    Company A had implementation timelines documented on their website. They shared customer Slack channels during discovery. They moved security conversations to the first call, not the fifth.

    Company B's reps kept saying "trust us." Prospects kept saying "let me think about it."

    What Trust Deficiency Looks Like

    • Prospects ask for "one more reference call" (and then another)

    • Security questions appear late and derail the timeline

    • The same objections surface repeatedly because proof is missing

    • Sales cycle length expands disproportionately as deal size increases

    The Fix: Front-Load Credibility

    Build an evidence library (proof, not claims):

    • Customer quotes with specific metrics

    • Implementation case studies with timelines

    • Third-party validation (G2, analyst mentions, certifications)

    Move risk conversations earlier:

    • Security questionnaire and SOC 2 on the website

    • Proactive "here's what could go wrong and how we handle it" framing

    Make implementation predictable and visible:

    • Documented onboarding playbook

    • Named CSM introduction before close

    • Week-by-week milestone expectations

    When implementing this approach with a fintech company we worked with, their sales cycle compressed by roughly 25-35%. The proof? Buyers had fewer reasons to hesitate.

    Key metric to track: Sales cycle length by ACV tier

    The takeaway: Speed is a function of trust, not tooling.

    Truth #4: Revenue Still Leaks at Handoffs

    Most pipeline problems are actually handoff problems. When marketing, sales, and customer success define "qualified" differently, revenue leaks at every transition. AI will automate these broken handoffs faster, not fix them. A unified revenue lifecycle with clear stage definitions and exit criteria is the foundation of a scalable GTM motion.

    The Story

    Marketing was celebrating. They'd hit 340% of their MQL goal.

    Sales was furious. They'd booked 12 meetings from those 847 MQLs.

    The problem? Marketing counted a content download as an MQL. Sales counted a demo request as an MQL.

    Same word. Different definitions. Zero alignment.

    This isn't a rare scenario. It's the default at most startups until someone forces alignment. Building cross-functional GTM alignment is often the highest-leverage fix we implement.

    Where Revenue Typically Leaks

    • Marketing → Sales: Lead quality isn't defined, so follow-up is inconsistent

    • Sales → Sales: Pipeline stages mean different things to different reps

    • Sales → CS: Deals close, then churn because customers expected something else

    • CS → Expansion: No systematic handoff from "healthy" to "expansion-ready"

    The Fix: One Lifecycle, One Language

    Define your lifecycle stages once and get every team to use them:

    Lead → Meeting → Opportunity → Closed → Onboarded → Retained → Expanded

    For each stage, document:

    Element

    Question

    Entry criteria

    What qualifies something to enter this stage?

    Exit criteria

    What must be true to advance?

    Owner

    Who's responsible?

    Time benchmark

    How long should this stage take?

    This is where revenue operations becomes essential – not as a data cleanup function, but as the system architect that prevents leakage.

    Key metric to track: Pipeline velocity and "time in stage" by segment

    The takeaway: Revenue doesn't disappear. It leaks. Find the holes.

    Truth #5: Distribution Still Beats Better Content

    AI has made content abundant. Attention is now the constraint. The winning GTM teams won't be those who publish the most – they'll be the teams who distribute to the right accounts, at the right moment, with the right message. Signal-based targeting is the new competitive advantage.

    The Story

    A B2B fintech published 3 blog posts per week for 6 months. 72 posts total.

    Pipeline influenced by content: 2 deals.

    They'd optimized for volume, not precision. Posts were written for "anyone in finance." Distribution was "post to LinkedIn and hope."

    We helped them flip the model: 6 high-intent assets, distributed to 200 named accounts with specific triggers.

    Pipeline influenced by content in the next quarter: 31 deals.

    Same team. Same budget. Different system.

    What "Content Without Distribution" Looks Like

    • Posts get likes but don't create pipeline

    • Outbound volume increases, reply rates decrease

    • CAC rises because targeting is broad

    • Lots of activity, little meeting volume

    The Fix: Signal-Based Distribution

    Pick one primary channel for pipeline (outbound, paid, partner, or inbound – not all four at once). Understanding when to double down on outbound vs. inbound prevents resource dilution.

    Build a signal layer:

    • Hiring signals – new VP Sales = budget and mandate

    • Funding signals – raise = growth pressure

    • Tech signals – new tool adoption = change in stack

    • Trigger events – compliance deadline, expansion, executive change

    Run weekly account-based execution:

    • 20 accounts per week

    • 3 personas per account

    • Sequenced across email, LinkedIn, and phone

    • Tracked by account, not by activity

    Our cold outreach framework breaks down this execution model step-by-step.

    Key metric to track: Meetings per 100 accounts targeted

    The takeaway: In an AI world, targeting is the advantage.

    Truth #6: GTM Still Compounds Through Loops, Not Linear Funnels

    Traditional sales funnels describe your internal process, but buyers don't behave linearly. They research, pause, return, add stakeholders, and re-evaluate. High-growth startups design GTM loops – content loops, customer loops, product loops – that compound over time. AI speeds up loops but doesn't create them.

    The Story

    A Series A company had incredible first meetings. Discovery was sharp. Demos were strong.

    Then: silence.

    Prospects would go dark for 3 weeks, then resurface with new requirements. Or new stakeholders. Or concerns nobody had raised before.

    The sales team kept treating this as a pipeline "problem." It wasn't. It was buyer behavior.

    Buyers loop: Research → Pause → Return → Pull in stakeholders → Re-evaluate risk → Renegotiate requirements

    The companies that win are the ones who design for loops, not against them.

    The Fix: Pick One Loop and Build It

    Content Loop: Publish → Capture engagement → Retarget engaged accounts → Publish content that addresses their specific concerns → Repeat

    Customer Loop: Close → Onboard → Capture success → Turn into case study → Use case study in sales → Repeat

    Product Loop: Ship → Capture feedback → Feed into messaging → Use in outbound → Ship improvements → Repeat

    From an operational perspective: Don't try to build all three loops at once. Pick one. Instrument it. Iterate weekly. The TruckX sales transformation we led focused on the customer loop first – capturing wins and operationalizing proof – before expanding to content and product loops.

    Key metric to track: % of pipeline influenced by repeat exposure (retargeting, re-engagement, referrals)

    The takeaway: Funnels measure flow. Loops create compounding.

    Truth #7: GTM Still Needs an Owner—And It Will Always Be CEO-Level

    Go-to-market strategy spans product, sales, marketing, RevOps, and customer success. Without a single owner at the executive level, each function optimizes locally – marketing maximizes MQLs, sales maximizes this quarter's closes, product maximizes features. The result is predictable: inconsistent growth and missed forecasts. GTM ownership is a CEO responsibility.

    The Story

    We asked a Series C CEO who owned GTM at their company.

    "Well, the CRO owns sales, the CMO owns marketing, the VP CS owns retention…"

    "But who owns the system? Who decides when marketing's definition of 'qualified' conflicts with sales'? Who decides whether to prioritize new logo vs. expansion?"

    Long pause. "I guess… me?"

    That's the right answer. But at this company, nobody had been acting on it.

    Result: forecast misses had become normal. Marketing and sales blamed each other quarterly. The board was losing confidence.

    What "No GTM Owner" Looks Like

    • Meetings are status updates, not decisions

    • Priorities change weekly

    • Messaging drifts by rep and by channel

    • Forecast misses become expected

    • Each team optimizes for their own metrics

    The Fix: Build the Operating System

    Establish a weekly GTM operating cadence:

    • Not status updates – decisions

    • Clear owners for every action item

    • 45 minutes max

    Define what "good" looks like:

    • North star metric (usually revenue or pipeline)

    • 3-5 leading indicators per function

    • Thresholds that trigger escalation

    Review GTM monthly, reset quarterly:

    • Monthly: Are we executing the plan?

    • Quarterly: Is the plan still right?

    Understanding how to measure GTM execution success gives leadership the visibility to make these decisions confidently.

    Key metric to track: Forecast accuracy and pipeline coverage by segment

    The takeaway: If the CEO doesn't own GTM, nobody does.

    Two GTM Patterns We See in Startups and Scaleups

    Pattern A: "AI-Powered Activity" with Weak Fundamentals

    • Outbound volume increases

    • Content output increases

    • Tools increase

    • Pipeline and meetings don't

    Root cause: Unclear ICP, weak positioning, misaligned lifecycle, no operating cadence.

    Outcome: Burn rate increases. Revenue doesn't.

    Pattern B: "Simple System" with Strong Execution

    • Clear ICP documented and enforced

    • One narrative used across marketing, sales, and CS

    • One lifecycle definition with exit criteria

    • One operating cadence with decisions

    • Tight enablement tied to real deals

    Outcome: Then AI accelerates what already works.

    2025-2026 Trend: As AI adoption saturates, the differentiation shifts from who has the best tools to who has the clearest system. Companies with Pattern B foundations are seeing 2-3x better ROI on their AI investments compared to Pattern A companies.

    The 90-Day GTM Implementation Roadmap

    Days 1–30: Build Clarity and Control

    Goal: Establish the foundation.

    Deliverable

    Owner

    Output

    Lock ICP and segments

    CEO + Sales

    "We win when…" doc

    Define triggers and buyer committee map

    Sales

    Trigger library + stakeholder matrix

    Write the narrative and core proof points

    Marketing

    Messaging framework

    Standardize lifecycle stages + exit criteria

    RevOps

    Lifecycle doc + CRM config

    Build consensus kit v1

    Sales Enablement

    One-pager + ROI model

    Checkpoint: You have a usable GTM blueprint, not a slide deck.

    Days 31–60: Build Pipeline Motion

    Goal: Generate consistent, qualified meetings.

    Deliverable

    Owner

    Output

    Choose the primary channel and distribution cadence

    Marketing

    Channel strategy

    Launch the outbound system with signal-based targeting

    Sales + Ops

    20 accounts/week motion

    Publish 3-5 high-intent content assets

    Marketing

    Trigger-aligned content

    Implement leakage and velocity dashboards

    RevOps

    Weekly reporting

    Build talk tracks, objection handling, and sequences

    Enablement

    Rep playbook

    Checkpoint: Consistent meetings from a repeatable system.

    Days 61–90: Compound and Scale

    Goal: Improve conversion and expand carefully.

    Deliverable

    Owner

    Output

    Improve conversion with friction removal

    Sales + Ops

    Stage-by-stage optimization

    Add retargeting and re-engagement loops

    Marketing

    Loop instrumentation

    Tighten onboarding handoffs

    CS

    Documented handoff

    Expand segments carefully (not randomly)

    CEO

    Expansion criteria

    Establish quarterly reset + weekly rhythm

    CEO

    Operating cadence

    Checkpoint: Predictable pipeline with measurable levers.

    Frequently Asked Questions About GTM Strategy and AI

    Will AI replace SDRs and outbound sales teams?

    AI will change the workflow, but outbound still succeeds on relevance, timing, and targeting. As AI increases volume across the market, precision becomes more important, not less. The SDR role evolves from "send more emails" to "orchestrate the right message to the right account at the right moment."

    Why do B2B deals stall even when we have a strong champion?

    Because B2B buying is consensus-driven. A champion who loves your product but can't align their CFO, security team, and implementation owner will lose to "no decision." The fix is giving champions tools (a consensus kit) to sell internally.

    What's the fastest GTM fix for an early-stage startup?

    Tighten ICP and narrative first. Then define lifecycle stages with exit criteria. Then run a weekly operating cadence with decisions and owners. This sequence works regardless of ACV, sales motion, or industry. Our GTM strategy guide for founders walks through this in detail.

    How do I know if my GTM problem is positioning, process, or people?

    Run the GTM Clarity Scorecard at the top of this guide. Scores 0-8 usually indicate positioning and process problems. Scores 9-14 usually indicate process and operating cadence gaps. People problems are real, but they're rarer than founders think – most "people problems" are actually system problems.

    What's the difference between a GTM strategy and a GTM operating system?

    Strategy answers "what are we doing and why." The operating system answers "how do we execute it week over week." Most startups have fragments of strategy and no operating system. That's why execution drifts and forecasts miss.

    How should startups think about GTM in vertical vs. horizontal markets?

    Vertical markets allow tighter positioning, more specific proof points, and higher win rates—but smaller TAM. Horizontal markets offer larger TAM but require more generic messaging and longer sales cycles. Most startups underestimate how long horizontal GTM takes to work. Start vertical, expand horizontal.

    Ready to Stop Scaling Chaos?

    Phi Consulting is a GTM execution partner for startups and scaleups in operationally complex industries – freight, fintech, logistics, proptech, and enterprise tech.

    We don't deliver slide decks. We embed a pod that builds and runs your GTM system: ICP and positioning, outbound and distribution, RevOps instrumentation, sales enablement, and the operating cadence that keeps it predictable.

    Here's how to start:

    1. Take the GTM Clarity Scorecard – 10 minutes to diagnose where you're leaking revenue

    2. Book a GTM Diagnostic Call – We'll review your score and identify the highest-leverage fix

    3. Get a 90-Day Execution Roadmap – Clear owners, deliverables, and metrics

    If your AI tools are scaling activity but not pipeline, you don't need more tools. You need a system.

    Talk to Phi about your GTM →

  • The GTM Metrics That Will Define 2026 (And Why Most Companies Will Miss Their Targets Before Q2)

    The GTM Metrics That Will Define 2026 (And Why Most Companies Will Miss Their Targets Before Q2)

    The GTM Metrics That Will Define 2026 (And Why Most Companies Will Miss Their Targets Before Q2)

    The Founder Who Did Everything "Right"… and Still Fell Behind

    In July, a founder of a $25M ARR SaaS company told us something we hear every week:

    "We doubled outbound. We increased spend. We hired more reps. But somehow… we're growing slower."

    Pipeline was up. Activity was up. Marketing was louder than ever.

    Revenue? Flat.

    Then he said the line that defined the entire conversation: "It feels like we're measuring everything… except what actually matters."

    And he was right.

    2026 will be the first year where companies won't miss revenue because of low pipeline or bad execution. They'll miss because they measured the wrong things—or worse, they confused activity metrics with outcome metrics.

    This isn't a new problem. But the stakes have changed. With AI-augmented teams, multithreaded buying processes, and CAC inflation hitting every channel simultaneously, traditional GTM measurement frameworks no longer predict success. They report failure… after it's too late to fix.

    Why 2026 Requires Different Metrics

    The GTM world has fundamentally changed—and most executive teams haven't updated their dashboards to match reality:

    Buyers are multithreaded – 3-7 stakeholders influence every mid-market decision, yet most CRMs still track single-contact deals
    CAC is rising unpredictably – paid gets noisier, organic gets harder, outbound gets less responsive
    AI redefined productivity – your best rep uses AI best, not works longest
    Pipeline is no longer the leading indicator – velocity, ICP accuracy, and retention tell the real story

    From an investor perspective, the companies that secure Series B funding in 2026 won't be those with the biggest pipeline -they'll be the ones who can prove engine efficiency at scale. Boards are asking tougher questions: "What's your GTM efficiency trendline?" and "How does AI impact your CAC payback?"

    For founders still optimizing for pipeline coverage ratios, these questions feel unfair. But they're not. They're the new standard. And building a mature RevOps function is how you get there.

    2026 will be dominated by companies that measure differently, not those that work harder.

    The 12 GTM Metrics That Will Define 2026

    Below is Phi’s 2026 GTM Precision Framework the metrics that predict revenue, not just report it. Each metric addresses a specific failure mode we see across growth-stage companies.

    1. TRM Accuracy Score

    What it is: The percentage of closed-won deals that match your Ideal Customer Profile criteria.

    Why it matters: A FreightTech company we advised believed their TAM was 300,000 fleets. Their revenue came from only one band: 25–99 trucks. Once we fixed their Total Reachable Market definition, everything improved – win rate, CAC, cycle time, expansion.

    If you're winning deals outside your ICP, you're building a retention nightmare. Every misfit customer drags down NRR, creates support noise, and dilutes your product roadmap. From a product perspective, these customers generate feature requests that pull you away from your core market.

    Benchmark: 70%+ of wins should fit your ICP definition.

    Operational insight: When a startup we worked with in the logistics space tightened their ICP from "any trucking company" to "fleets with 25-99 trucks using legacy TMS systems," their win rate jumped from approximately 18% to 41% in 90 days. The deals also closed roughly 30% faster.

    GTM Performance Through ICP Alignment
    GTM Performance Through ICP Alignment

    2. Pipeline Velocity Index (PVI)

    What it is: A weighted score measuring how fast deals move through each pipeline stage, factoring in conversion rates and time spent per stage.

    Why it matters: A SaaS company had beautiful pipeline numbers but died in Stage 2 (technical validation). Forecast didn't catch it. PVI did. Velocity collapses before revenue collapses – usually 60-90 days before your forecast shows the miss.

    Traditional pipeline reporting shows volume. PVI shows momentum. And momentum is the earliest predictor of revenue outcomes. This is a core element of effective GTM execution measurement.

    Benchmark: Track week-over-week trends. A 15%+ drop is an early warning system.

    CEO perspective: One founder told us, "PVI gave us 8 weeks of runway to fix our demo-to-eval conversion problem before it cratered our quarter. That's the difference between a miss and a save."

    3. Revenue Velocity by Motion (RVM)

    What it is: Revenue generated per day by each GTM motion (outbound, inbound, partner-led, PLG), calculated as:
    (# of deals × avg deal size × win rate) / avg sales cycle days

    Why it matters: A FinTech client thought outbound was their engine. RVM showed partner-led deals were 3× faster and 2× higher margin. Your real GTM engine is often not the one you invest in.

    Most companies allocate headcount and budget based on what's always been done, not on what actually produces efficient revenue. RVM forces motion-level accountability.

    Action: Build motion-level P&L. Kill underperforming motions. This connects directly to choosing the right GTM motion to scale.

    Customer journey insight: From the buyer's perspective, partner-led deals often convert faster because trust is pre-built. The partner acts as a validator, reducing the buyer's perceived risk.

    4. CAC Payback by ICP Tier

    What it is: Time to recover customer acquisition costs, segmented by ICP tier (A, B, C customers).

    Why it matters: One founder bragged about 13-month CAC. Segmented CAC told the truth: A-tier was 7.5 months, B-tier was 12 months, C-tier was 38 months. They didn't realize a third of their customers were unprofitable.

    Blended CAC hides the truth. Segmented CAC reveals which parts of your GTM motion are actually destroying value. For early-stage companies, this is often the difference between efficient growth and a death spiral. Our detailed CAC optimization strategies dive deeper into this.

    Benchmark: C-tier payback should never exceed 18 months. If it does, stop selling to them.

    Investor lens: VCs increasingly ask for CAC payback by cohort and tier. Blended numbers don't cut it anymore. They want to see unit economics at the segment level.

    5. Product Activation Time (PAT)

    What it is: Time from contract signed to customer achieving their first "Aha Moment" (not first login-actual value delivery).

    Why it matters: A client cut activation from 28 days to 8. NRR jumped, churn dropped, expansion surged. Faster activation creates momentum. Momentum creates retention. Retention creates expansion.

    From a customer success perspective, activation is the most critical window. If customers don't see value fast, they start second-guessing the purchase decision. That's when churn risk begins—long before renewal.

    Benchmark: <15 days for SaaS, <30 days for complex enterprise products.

    Operational example: When implementing onboarding optimization for a cloud infrastructure client, we mapped every friction point in their activation journey. By removing unnecessary configuration steps and adding proactive CS check-ins at Day 3 and Day 7, they reduced activation time by approximately 60%.

    6. Expansion Efficiency Ratio (EER)

    What it is: Expansion ARR divided by the cost of your customer success and account management teams.

    Why it matters: New logo CAC is rising. Expansion CAC stays flat. The cheapest revenue is already in your base. 40-60% of growth should come from existing customers in 2026.

    Most companies treat customer success as a cost center. High-performing companies treat it as a revenue engine. EER measures how commercial your CS team actually is.

    Benchmark: EER >3.0 is good. <1.5 means your CS team isn't commercial enough.

    Founder insight: "We had 8 CSMs focused on 'happiness.' Zero expansion. We reorganized around commercial outcomes, trained them on upsell triggers, and EER went from 0.7 to 3.4 in one quarter." – Series B SaaS founder

    7. Margin-Adjusted NRR (MA-NRR)

    What it is: Net Revenue Retention weighted by gross margin percentage of each customer cohort.

    Why it matters: A FinTech client had 128% NRR. When weighted by margin? 91%. They were retaining and expanding low-margin accounts while losing high-margin ones. Traditional NRR hides the truth. MA-NRR exposes it.

    Standard NRR treats all revenue as equal. But not all revenue is created equal. A dollar of 80% margin revenue is worth far more than a dollar of 20% margin revenue-especially at scale.

    Action: Segment CS efforts by customer margin, not just ARR. This is part of a broader data-driven GTM strategy.

    CFO perspective: MA-NRR is the metric that should drive compensation planning for customer success and account management teams. Rewarding retention without considering margin creates perverse incentives.

    8. GTM Efficiency Ratio v3 (GTM ER v3)

    What it is: Net new ARR divided by total GTM costs (sales + marketing + CS + tooling), enhanced with AI productivity factors and cost per funnel stage.

    Why it matters: Boards will ask: "What is your GTM efficiency trendline over the last 90 days?" This is the new "Rule of 40" for growth-stage companies.

    Traditional efficiency ratios don't account for AI impact. A rep using AI for research, email generation, and meeting prep can handle 2-3× the pipeline of a non-AI rep. GTM ER v3 adjusts for this reality.

    Benchmark: >0.8 is good, >1.2 is exceptional.

    Example from our work: With a B2B SaaS startup, we implemented AI-powered sales workflows (research automation, email generation, CRM updates). Their GTM ER improved from 0.6 to 1.1 in two quarters-without adding headcount. Understanding how RevOps steers GTM strategy is critical here.

    9. Revenue Leak Rate (RLR)

    What it is: The percentage of pipeline value lost to preventable causes-unworked leads, stuck deals, single-threaded opportunities, ignored churn signals.

    Why it matters: We found a client was "leaking" more pipeline than they were losing to competitors: 19% inbound unworked, 31% stuck at compliance, 26% single-threaded, 14% churn signals ignored. Fixing leak produced more revenue than doubling top-of-funnel.

    Most companies obsess over generating more pipeline. The best companies obsess over not wasting what they already have. RLR measures execution discipline.

    Benchmark: Total RLR should be <15%. Anything above 20% is a crisis.

    Operational drill-down:

    • Unworked inbound: Leads that came in but were never contacted (routing failures, rep capacity issues)

    • Stuck deals: Opportunities that haven't moved in 30+ days

    • Single-threaded: Deals with only 1 contact (high ghosting risk)

    • Ignored churn signals: Customers showing red flags (low usage, support complaints, no expansion)

    10. AI Utilization Score (AUS)

    What it is: Weighted score (0-100) measuring AI adoption across email generation, meeting intelligence, content creation, research, forecasting, and CRM automation.

    Why it matters: 2026's top-performing reps won't be the hardest-working. They'll be the most AI-augmented. We're seeing 2-3× productivity gaps between high-AUS and low-AUS reps doing the same job.

    The companies that scale efficiently in 2026 won't hire more reps-they'll multiply the output of existing reps with AI. This is the shift from hiring headcount to scaling with AI.

    Benchmark: Team average should be >50 by Q2 2026.

    From the rep's perspective: "I used to spend 4 hours a day on research, email follow-ups, and CRM updates. Now AI handles 80% of that. I spend my time on calls and strategy." – AE at a Series B company

    11. Multithreaded Deal Ratio (MDR)

    What it is: Percentage of deals in Stage 3+ with 3+ active contacts (economic buyer + technical buyer + champion minimum).

    Why it matters: If MDR <50%, your pipeline is lying to you. Single-threaded deals have a 75-85% loss rate in late stages. Deals with only one contact almost always die when that person ghosts, changes jobs, or loses internal political capital.

    Benchmark: >60% for mid-market, >75% for enterprise.

    Buyer journey reality: In 2026, buying decisions in B2B involve 6-10 stakeholders on average. If you're only talking to one, you're not in the real conversation. You're in the polite-no conversation.

    Tactical advice: Track MDR weekly. If a deal enters Stage 3 without 3+ contacts, it should trigger an automatic workflow: "Who else should we involve?"

    12. C.A.T. Score (Clarity, Alignment, Trust)

    What it is: A cultural health score measuring whether teams understand priorities (Clarity), work toward the same goals (Alignment), and trust each other and leadership (Trust).

    Why it matters: We've tracked C.A.T. scores across 40+ companies. Every time it dropped below 70%, revenue missed 90-120 days later. Cultural misalignment destroys execution before it shows up in metrics.

    Most GTM failures aren't technical-they're cultural. When sales doesn't trust marketing's leads, when CS doesn't trust sales' promises, when leadership doesn't trust the forecast-execution collapses.

    Benchmark: >75 is healthy, <65 is danger zone.

    How to measure it: Quarterly anonymous surveys with 10-15 targeted questions. Track trends over time. C.A.T. is a leading indicator of operational health.

    A Founder's Turnaround: What Happens When You Measure the Right Things

    The founder from the intro rebuilt his GTM engine using this framework. In 90 days:

    -Win rate: +91% (23% → 44%)
    -CAC payback: -28% (13mo → 9.4mo)
    -Sales cycle: -17 days
    -Forecast accuracy: +40 points (58% → 98%)
    -NRR: 103% → 121%
    -Expansion now exceeds new logo revenue

    He told us: "For the first time in 18 months… I actually understand how our revenue engine works."

    Cost of implementation: $47K
    Revenue impact Year 1: $3.2M incremental ARR

    GTM Engine Rebuild
    GTM Engine Rebuild

    That's the power of precision metrics. This transformation followed our GTM strategy execution playbook – focused, measurable, and tied to revenue outcomes.

    Where Competitor Frameworks Fail

    Your competitor's GTM model misses:
    -AI impact
    -Revenue leakage
    -Activation velocity
    -Expansion efficiency
    -Multithreading
    -Motion-level economics
    -Velocity as a leading indicator
    -Margin weighting
    -Cultural alignment

    Most frameworks measure outcomes. Ours measures engines.

    That's the difference between knowing what happened and knowing what will happen.

    What These Metrics Actually Change for CEOs

    These 12 metrics help CEOs answer the only questions that matter:

    Where should we invest? (RVM shows which motions produce revenue, not noise)
    Where should we cut? (CAC by tier shows what destroys margin)
    Where are we leaking revenue? (Fixing leaks is faster than building pipeline)
    How do we hit the number without adding headcount? (AI + precision, not brute force)
    What will cause our next miss? (And how do we prevent it now)

    From a board perspective, these aren't "nice to have" metrics. They're the metrics that determine whether you get your next round, hit your revenue plan, or run out of runway trying.

    2026 Will Reward Teams Who Measure Differently

    Most companies will chase volume, overhire, overspend, misalign, and try to "out-activity" the market.

    The companies that win will:
    – Measure precisely
    – Adopt AI deeply
    – Align leadership
    Fix TRM
    – Accelerate activation
    – Stop leakage
    – Invest in the right motions
    – Build momentum from expansion

    2026 doesn't reward effort. It rewards precision.

    Achieving GTM Precision in 2026
    Achieving GTM Precision in 2026

    The startups securing Series B funding won't be the loudest – they'll be the ones with clean unit economics, efficient GTM motions, and predictable revenue engines. Investors are tired of "pipeline theater." They want proof of engine efficiency.

    Build Your 2026 GTM Engine With Phi Consulting

    Phi Consulting has helped:
    AtoB grow from 72 customers to 7% market shareShipwell build a predictable outbound engine
    DataTruck scale 10× via modern GTM systemsTruckX go from $2M to $16M ARR in 14 months

    We don't build dashboards. We build GTM engines that hit the number.

    Book a 15-minute GTM scoping call. No pitch. Just truth.